Kevin Wernli
Physiotherapist & PhD Candidate
(3-4 minute read)
Some of you may be familiar with the open access paper published in the Physical Therapy Journal in 2018 titled “Cognitive Functional Therapy (CFT): An integrated Behavioral Approach for the Targeted Management of Disabling Low Back Pain” (see here). It’s proven to be very popular with an Altmetric score (a score for how much attention it has received) of 686, placing it within the top 5% of all research outputs!
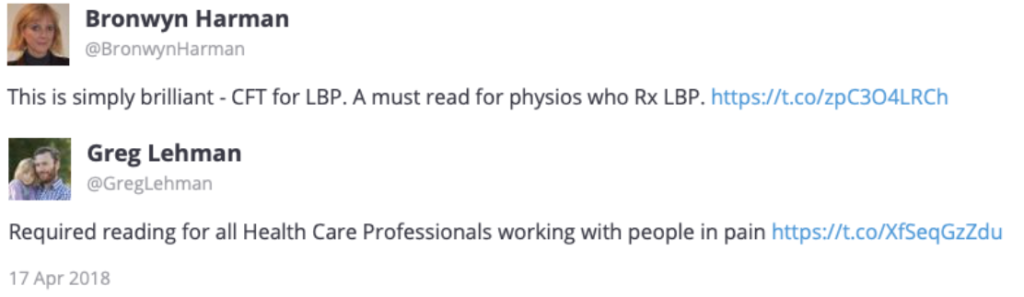
It received praise in the ‘twittersphere’ where it was dubbed as “simply brilliant” and “Required reading for all Health Care Professionals working with people in pain”.
So if you haven’t read it yet… put aside some time in your diary, grab a glass of (insert liquid here – alcohol optional), and read it (it’s free!).
Scientific papers like this (especially if they are open access) are one-way in which findings from research can be translated into clinical practice. But the nature of research papers is, they are usually several pages, written with academic jargon and often behind a pay-wall – all barriers for busy clinicians who are frequently the exact people we are trying to share this information with!
Sean Achor, a psychologist and researcher from Harvard University, reports that a scientific paper gets read on average 7 times (that’s right, seven!)(see here). After getting over the initial despair of this news being a researcher myself, it’s easy to see why this is the case given the barriers mentioned above. But it’s also paradoxical based on how much effort goes into a paper (proposals, grants, ethics, registrations, equipment testing, data collection, analysis, submission, peer-review, etc etc).
Whilst scientific papers certainly have their place, we want to make research as easily digestible, visually pleasing, engaging, and free for as many people as we can, so we spend time producing infographics, videos and blogs. I also collaborate with organisations such as ‘Physio Network’, ‘Trust me, I’m a Physiotherapist’, and ‘TREK’. These are just some of the ways we try to translate academic findings to patients and clinicians, in an attempt to reduce the gap between science and clinical practice (commonly quoted as 17 years). The internet seems to like these efforts based on the amount of engagement these resources receive (this 3 minute video summarising my PhD reached more than 60’000 people!).
The story of the CFT for Back Pain Infographic:
A common (and important) theme among those who recover from disabling back pain is a change of mindset(see here). We wanted to capture this journey of ‘mindset change’ in visual form, based around the 2018 CFT paper. And so, the infographic was born with input from Peter O’Sullivan, JP Caneiro, Kieran O’Sullivan and Mary O’Keeffe. (Technically reborn following multiple discussions, input from patient voices such as Joletta Belton and Pete Moore, and 17 revisions!).
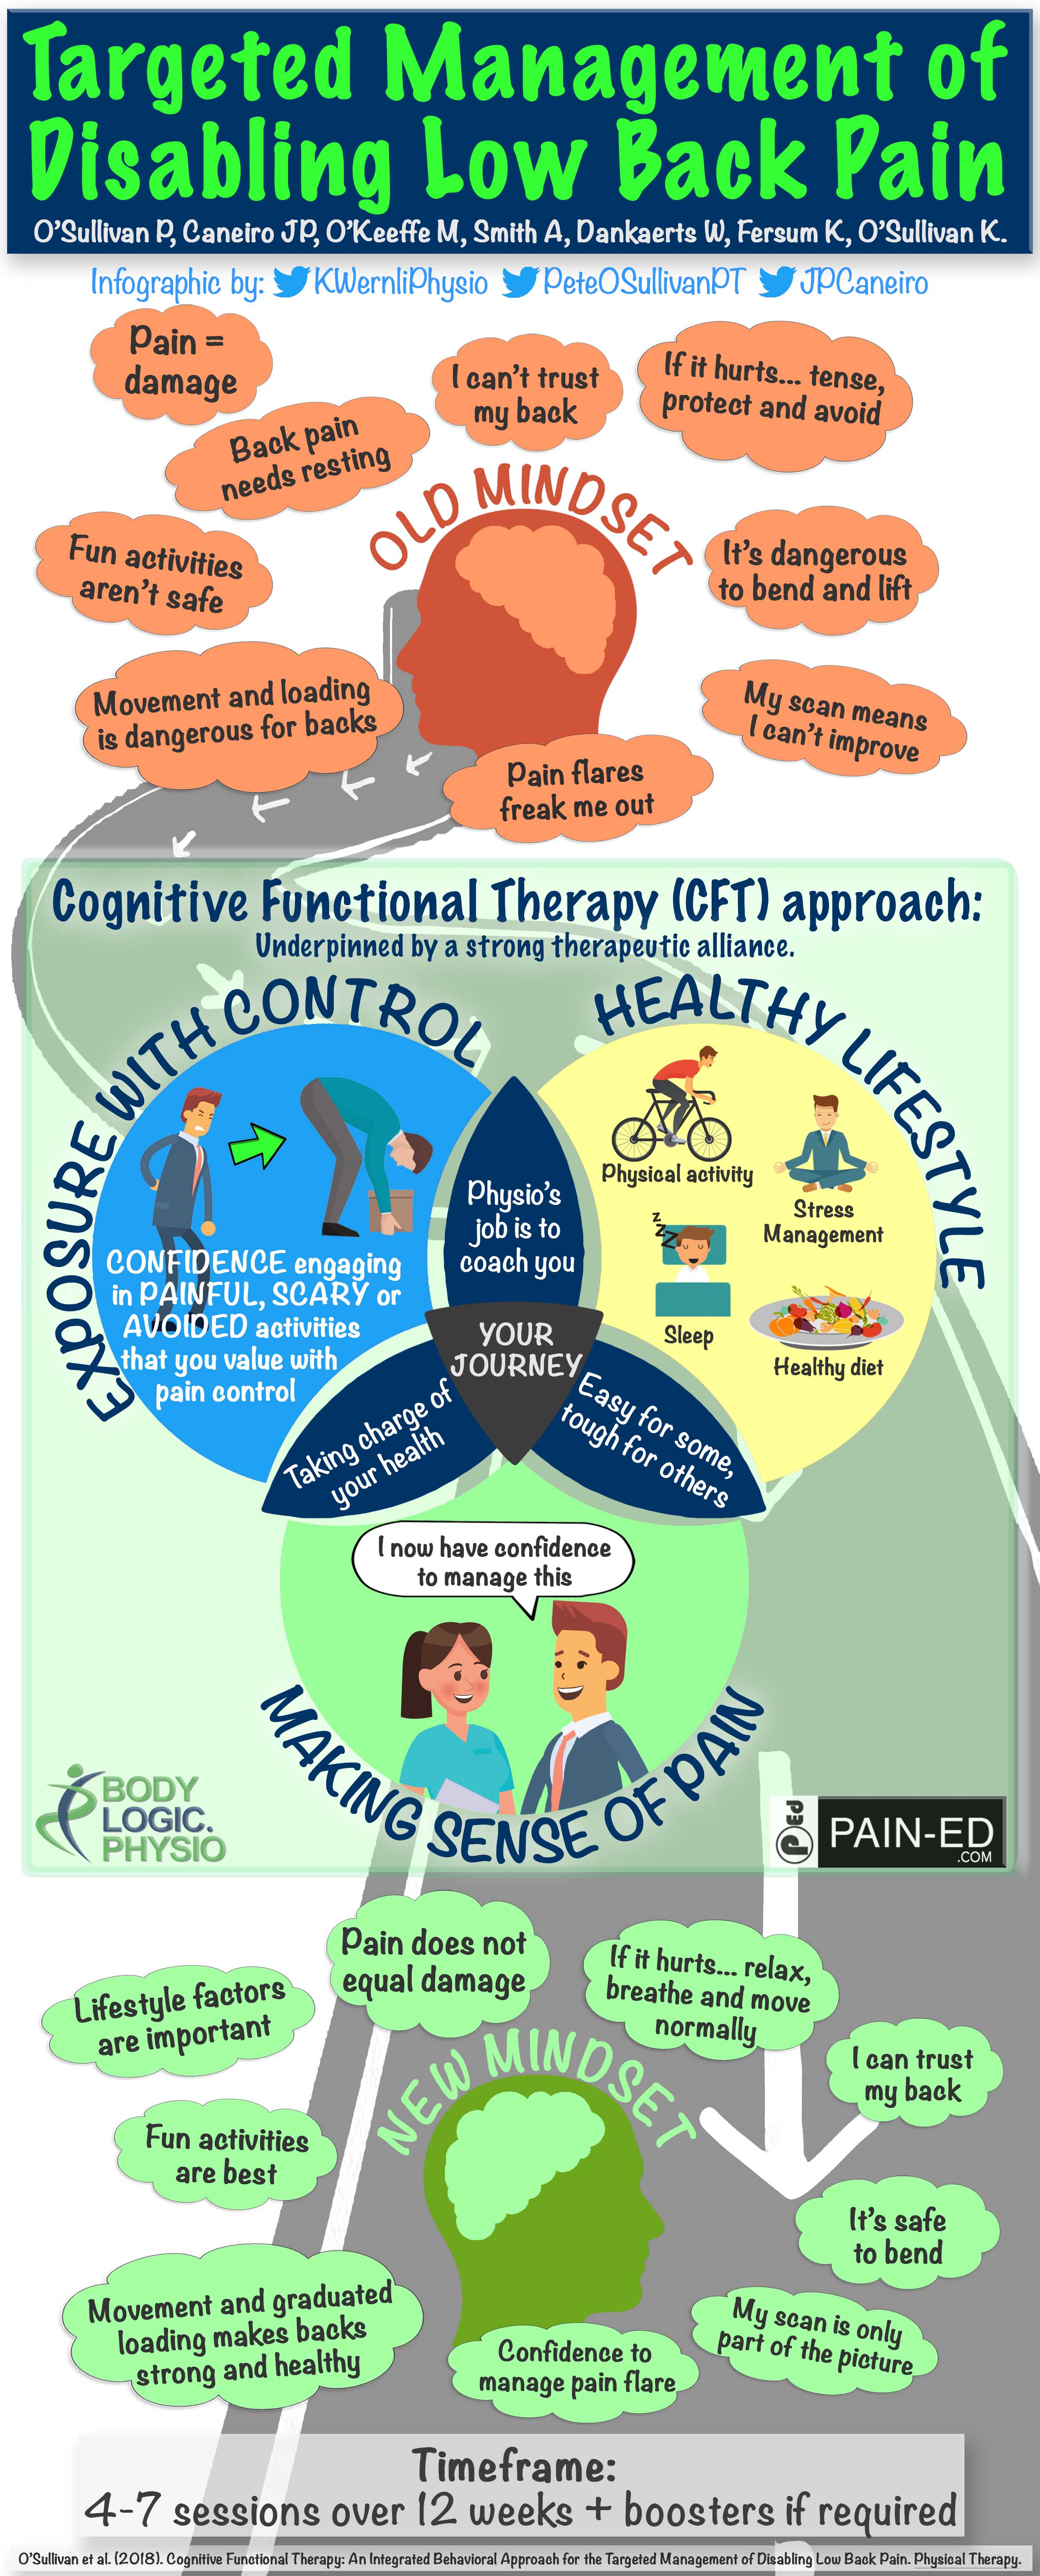
The final version (version 17!) of the CFT infographic. Free for public use and sharing in original form and with due credit
Our goal was to make an infographic that can be handed to people in pain, put up in hospitals and health service waiting rooms, and act as a bit of a ‘road-map’. And one that is of course scientifically rigorous.
The common beliefs in the top of the graphic (old mindset) are often the trip hazards that keep people trapped in a loop of pain, protection and distress, and are directly targeted in the CFT intervention (hence the name, Cognitive Functional Therapy). Importantly, they are not targeted didactically or through lecturing, but through experiential learning and reflective questioning – for more information on the ins and outs of the intervention… read the paper.
Another important aspect of the infographic is at the bottom:
“4-7 sessions over 12 weeks + boosters if required”
While some people change a lot in the first session (see the work of JP Caneiro here and here), we are all individual humans and variability is inevitable in the process of recovery. It also takes experience to coach someone from high to low levels of pain and fear (again see here and 1min video here).
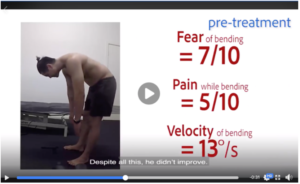
A 60 second video discussing my PhD through a patient story.
Health professionals can sometimes compare the individuals they see in their clinic to the ‘one session’ success stories posted online, so having this timeframe section on the graphic helps give a tangible, temporal reference.
Clinically, I’ve found this to be helpful in highlighting to patients that the process can take time, it is not a quick fix, and that it’s okay (and likely) that there will be ups and downs on the journey. Some of the data from JP Caneiro’s work highlights this well as does the early analysis from my PhD study (more on that later… watch this space).
Summary:
We want to do everything we can to help those in pain, and those that work with those in pain, be up to date with what the research is telling us. We have many infographics and other media like this one that we share on our twitter (@KWernliPhysio, @PeteOSullivanPT, @JPCaneiro @Pain-Ed and on Pain-ed.com)
If you can think of other great way’s you’d like to be engaged with, or that you’d like this research presented, or have any other great ideas, feel free to fill in this 1minute survey and help us bridge the evidence-to-practice gap.
SPOILER ALERT: We are currently producing a similar infographic that is not specific to low back pain and applicable for all pain… watch this space!
Special thanks to Professor Peter O’Sullivan and Dr JP Caneiro for their review of this blog prior to publication.
About the Author:
Stay Connected